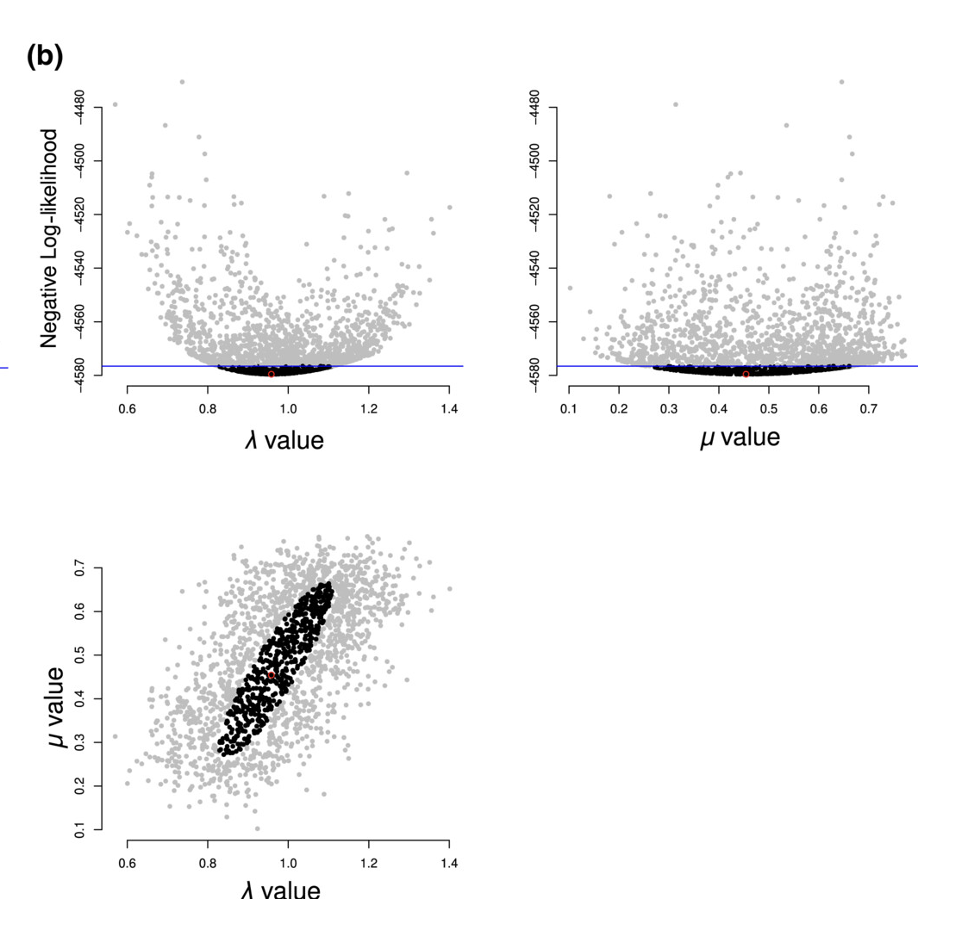
If you want to estimate the uncertainty in parameter estimates, including potential correlation issues between parameters, you can use our new package dentist (Boyko and O’Meara, 2024). It can take a function that computes a likelihood and explore parameters around it to get uncertainty, including varying by multiple parameters at once to help detect ridges.
If you don’t know why you want this, read on.

There are many R functions that use likelihood to fit models (OUwie, geiger, corHMM, phytools, and many more), which are often compared with measures like the Akaike Information Criterion (AIC). Jeremy Beaulieu and I (among many others) have long pushed for for people to focus on parameter estimates rather than just which model fits best. An Ornstein-Uhlenbeck model with two optima might fit better than a model with one, but while it is statistically supported it might not be biologically very relevant if the optima are close and the tip values range much more widely due to a low pull parameter. If different species range in size from 2 to 30 mm, two optima of 5 and 7 mm rather than one of 6 mm might not matter much in practice.
But even when people report parameter estimates, they often don’t report uncertainty in those estimates. This is deeply weird. We’re used to seeing “42 (CI 37-52) mm” or “42 ± 9 mm” but in comparative methods, people will only report “42 mm” (or, more commonly, “42” since we often omit units, too?!).
A major reason for this is lack of tools. Some software does not calculate uncertainty at all. Some does, but only using an approximation of curvature at the peak itself (methods using the Hessian). Others do it with a Bayesian approach, which has some advantages, but requires setting a prior, and which can hide ridges in the likelihood surface if the prior is uniform, lognormal, normal, exponential, or anything else that is not perfectly flat for all values.
Dentist is a new approach. It has something of the feel of MCMC, but rather than traversing a surface of likelihood times prior, it explores a “dented” likelihood surface to find the contour with points far enough from the optimum to represent a confidence interval. Imagine a likelihood surface is a mountain peak; we dent it so that it looks like a crater, and we try to find the rim. We have algorithms to do this with different kinds of moves if needed.
When it is done, the user gets not only the best parameter estimate but also a visualization of the confidence region around this space and a table with the parameter bounds. They can thus see ridges, as well as get a good estimate based on looking at the actual surface rather than just an estimate at the discovered peak.
For more details on why to use it, how to use it, and how it can fail, please see the paper.
It was a joy working with James Boyko on this. He was essential for pushing it forward, testing methods, writing, and so much more.
Our paper has the usual boilerplate about thanking the reviewers and associate editor (Natalie Cooper). But in this case it is genuine. The paper, and method, improved through peer review (most essentially by encouraging us to let the threshold be set based on the number of parameters rather than left entirely up to the users, but in other ways, too, including pushing us to compare more directly with other approaches). There are lots of issues with peer review (biases in the reviews, unpaid expert efforts for obscenely profitable companies, delays in publication, impact selection, and more) but it really can help sometimes, as it did here.
And finally, thank you to the US National Science Foundation (grant DEB-1916539) and the Eric and Wendy Schmidt AI in Science Postdoctoral Fellowship, a Schmidt Futures programme.
To subscribe, go to https://brianomeara.info/blog.xml in an RSS reader.
Citation
@online{o'meara2024,
  author = {O’Meara, Brian},
  title = {Dentist for Likelihood},
  date = {2024-02-29},
  url = {https://brianomeara.info/posts/dentist/},
  langid = {en}
}